Your business.In focus.In control.

Reports, budgets and dashboards in one financial platform. See profit and cash, compare performance with plans and understand what needs attention.
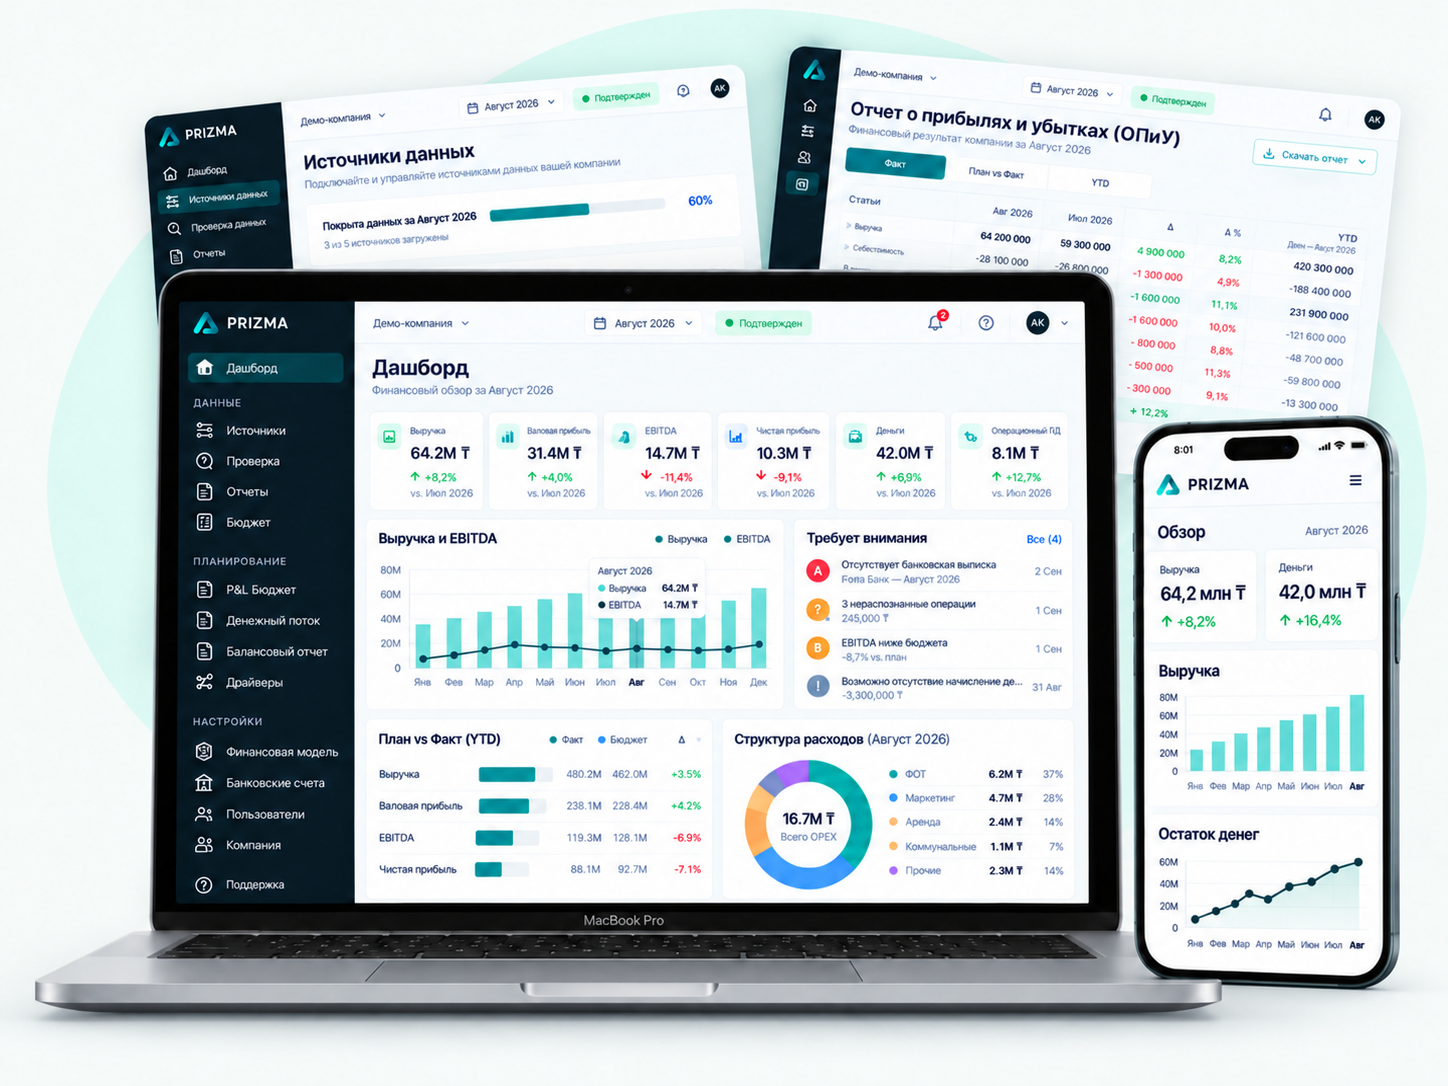
For business owners, leaders and finance teams
Illustrative PRIZMA screens on a laptop and phone: dashboard, data sources, P&L and financial metrics.
Illustrative data
Works with your
financial data
1CBank statementsExcelE-invoicesTax forms
Clarity for every decision

Important questions.
Clear answers.

Understand where your business stands today and where your plans could take it tomorrow.

01

How much do we earn?

Revenue, costs, EBITDA and net profit. Compare periods and trace the result back to its source data.

02

Where does the cash go?

Cash flows, account balances, receivables and payables in one coherent financial view.

03

What comes next?

Budgets and projected cash balances. See variances and potential cash shortfalls before they arrive.

See how it works

From the big picture
to the business detail.

Explore reports, dashboards, budgeting and cash management with illustrative business data.

01 / 04

The full picture. One screen.

Key metrics, trends and signals that need your attention. Move from a headline number to the detail behind it.

  • Revenue, EBITDA and cash
  • Actual, budget and forecast
  • Financial and industry KPIs
Available in the platformRequest a demo
PRIZMA.financeDemo company · Illustrative data

Your business at a glance

January — June 2026 · m KZT
1C · example
Revenue
288.0 m KZT
+4.3% · Revenue plan
Gross profit
132.0 m KZT
45.8% · margin
EBITDA
64.0 m KZT
22.2% · margin
Net profit
46.4 m KZT
16.1% · margin
Cash balance
31.2 m KZT
at period end
Net cash flow
16.2 m KZT
Example with fictional data
Monthly revenue and EBITDA
Monthly revenue and EBITDA — Example with fictional data6040200JanFebMarAprMayJun
RevenueEBITDARevenue plan
Requires attention
!
Overdue receivables

2.4 m KZT

Reconcile payments against contracts
↗
Revenue above budget

+4.3% · Budget

Review the contribution of core and additional sales
i
Source completeness

Check source completeness before closing the period

↗
Budget vs actual · half-year
MetricActualBudgetΔ %
Revenue288.0276.0+4.3%
Gross profit132.0128.0+3.1%
EBITDA64.066.0−3.0%
Net profit46.448.0−3.3%
Cash position
Opening balance15.0 m KZT
Receipts306.0 m KZT
Payments−289.8 m KZT
Net cash flow16.2 m KZT
Closing balance31.2 m KZT
Operating expense mix
224.0m KZT
Payroll132.059%
Materials and purchasing40.018%
Rent24.011%
Other expenses28.013%
Net profit trend
Jan: 4.8; Feb: 6.4; Mar: 8.0; Apr: 8.8; May: 9.6; Jun: 8.8051015Jan: 4.8 m KZTJanFeb: 6.4 m KZTFebMar: 8.0 m KZTMarApr: 8.8 m KZTAprMay: 9.6 m KZTMayJun: 8.8 m KZTJun
Example with fictional data

Illustrative screens with fictional data. Treasury is shown as a proposed module concept.

Platform capabilities

Financial management.
From data to action.

Bring the workflow together: collect data, check it, understand performance and plan the next step.

01
Available

Reporting and data control

Build management reports and understand how each number is formed.

P&LCash flowManagement balance sheet1C connectionBank statement and Excel importE-invoices and tax formsTransaction and journal checksAI-assisted classificationDuplicate detectionData completeness controlCash, P&L and balance reconciliationPeriod comparisonsReport export
02
Available

Budgeting and forecasting

Turn operating plans into a financial model and track delivery.

Drivers and formulasSales planningOPEXPayroll: staff, vacancies and taxesCAPEX and depreciationP&L and cash budgetsForecast balance sheetBudget vs actual1–36 month horizonCash balance forecast
03
Available

Management dashboards

See the business through the metrics that matter to its owners and industry.

Revenue and profitabilityEBITDA and cash flowReceivablesIndustry KPIsActual / budget / forecastFilters and drill-downsData discrepancy signalsPrior-year comparison
04
Implementation on request

Treasury and payments

Plan receipts and payments, organize approvals and track payment execution.

Payment requestsApprovals and prioritiesPayment calendarPayment registerLiquidity planningExecution tracking
The financial logic of your industry

One platform.
Different business models.

We tailor the accounting structure, drivers and metrics to your company.

Manage the economics of services

EducationMedical servicesFood serviceTransport and logisticsAgency servicesOilfield services

Connect service volume, team utilization and costs with profit and cash flow.

Analysis scope and data sources are agreed during implementation.

  • Revenue and profitability by business line
  • Customers, service volume and resource utilization
  • Payroll and operating expenses
  • Budgets and cash flow forecasts
Subscribe to the tools you need

Your scale.
Your financial toolkit.

Start with a clear financial picture. Add planning and payment management as your needs grow.

Reports and dashboards

Control

Understand profit, cash and key business metrics.

Standard price
70,000₸
/ month
70,000 ₸Billed monthly
 
Per company · one legal entityChoose this plan
  • P&L, cash flow and management balance sheet
  • Financial and industry dashboards
  • Data import, checks and reconciliation
  • Period comparison and drill-downs
Reports and dashboards + Budgeting + Cash management

Management

Connect insights, plans and payment control.

Standard price
130,000₸
/ month
130,000 ₸Billed monthly
 
Per company · one legal entityChoose this plan
  • Everything in Planning
  • Payment requests and approvals
  • Payment calendar
  • Payment register and execution tracking
Treasury is enabled under an agreed implementation plan. Bank-client integration is discussed separately.

One-time implementation, priced separately

Configure your financial workflow and receive a full business financial analysis in 2–4 weeks. The fee depends on revenue, industry and data complexity.

Estimate implementation
Choose this plan

Your path to getting started

From choosing modules to your first management decisions, with a clear next step at every stage.

  1. 01

    Choose your subscription

    Compare modules and billing terms. See both the monthly equivalent and the total upfront payment.

  2. 02

    Get a proposal

    Select your industry and revenue. A demonstration helps us confirm sources, requirements and the final quote.

  3. 03

    Agree and launch

    Confirm scope, contract and payment. Implementation takes 2–4 weeks after required data and access are provided.

  4. 04

    Put the results to work

    Receive configured reports, business analysis and training. Your subscription supports ongoing platform use.

A finance professional setting up your own company?

Discuss self-implementation and suitable templates with us. Online registration and subscription checkout are the next stage of the service.

Discuss self-implementation
Implementation in 2–4 weeks

A configured system.
A business understood.

Implementation includes full business financial analysis: profitability, cost structure, cash flows, liquidity and working capital. You receive a configured platform and a practical action plan.

Estimate implementation
  1. 01

    Week 1 · needs and sources

    Review your business model and data, and agree the management accounting structure.

  2. 02

    Weeks 1–2 · configure and validate

    Connect standard sources, configure reporting and investigate discrepancies.

  3. 03

    Weeks 2–3 · analyse and plan

    Analyse financial performance and develop findings. Configure budgeting and treasury within the agreed scope.

  4. 04

    Weeks 3–4 · hand over to your team

    Present the analysis, recommendations and completed reports. Train users and agree the working process.

How results take shape
01

Sources

1C, statements, Excel and documents

02

Checks

Classification, duplicates and reconciliation

03

Reports

A connected view of profit and cash

Confidence in every number

Financial logic.
Traceable results.

Behind each metric are source data, accounting rules and checks. PRIZMA helps finance teams explain the result and leaders use it to make decisions.

Traceability

Move from a headline metric to its components and source data.

Built around your business

Agree on line items, drivers and metrics during implementation.

Before you begin

Frequently asked questions

Does PRIZMA replace 1C?

PRIZMA uses 1C and other source data for management reporting, planning and financial control. Your accounting team continues to work in its accounting system.

Can we start without a direct 1C connection?

Yes. You can use Excel exports from 1C, bank statements and supported files. We assess source requirements and any additional work when preparing the project.

Who is the platform for?

Owners and leaders of growing companies, in-house finance professionals and financial consultants. Leadership gets the overall picture; finance teams get tools for accounting, checking and planning.

Are all the modules shown available?

Reporting, data checks, budgeting and dashboards work in the current platform. Treasury — payment requests, a payment calendar and a payment register — is implemented on request. We agree its scope and launch timing separately.

Can we manage multiple legal entities?

The current financial model and reporting are maintained separately for each client / legal entity. Group consolidation is outside the standard scope and is discussed separately.

How is pricing determined?

Subscriptions are KZT 70,000, 95,000 or 130,000 per month, depending on modules. We propose upfront discounts of 5%, 10% and 15% for 3, 6 and 12 months. Implementation is separate; estimate it using your industry and annual revenue.

What does implementation include, and how long does it take?

Selected module setup, standard data connections, reconciliation, full financial analysis, recommendations and training. Allow 2–4 weeks after the necessary data and access are available. Final scope and timeline are confirmed in the proposal.

The next step

See your business
through PRIZMA.

In a demonstration, we will show the path from data to reports, budgets and decisions. Then we will discuss how it could work for your company.

The PRIZMA.finance team
An email to info@prizma.finance will open. Review and send it from your email application. Form data is not stored on this website.
PRIZMA.finance

Estimate your PRIZMA implementation

Two business details give an initial estimate. Add your name and phone number to discuss the calculation and receive a proposal.

A message with your estimate will open. Review and send it in WhatsApp or your email app. This website does not store your name or phone number.

PRIZMA.finance · Illustrative data

What makes up revenue

Illustrative drill-down. The live platform provides access to the components of a metric and its source data.

January — June 2026 · m KZT

MetricRevenue
Core sales250.0
Additional sales26.0
Other revenue12.0
Total288.0

Demonstration request data

Forms prepare a message for WhatsApp or your email application. Names, phone numbers and other entered fields are not stored by this website or sent automatically. Data is shared when you send the message yourself in the selected application. Contact: info@prizma.finance.

info@prizma.finance